If you want to measure sales efficiency, or how profitably you acquire, retain and upsell customers, \your LTV:CAC ratio is a wise place to start. This ratio includes two key performance indicators — customer lifetime value and customer acquisition costs. However, if you look at CAC and LTV on their own, they don’t necessarily tell you the whole story.
For example, if your average customer LTV is $1,000, that sounds like things are going swimmingly. But if you spent $2,000 acquiring them, you’re underwater! The LTV:CAC ratio provides valuable insight into your acquisition methods’ efficiency and efficacy and whether they align with the profits you earn from each customer.
What Is an LTV:CAC Ratio?
One of the best barometers to analyze the efficiency of your sales and marketing output and how well you monetize customers is the LTV:CAC ratio. Spending lots of money to acquire unprofitable customers is a recipe for disaster. This metric can relay a lot of information about your profitability and provide an at-a-glance measure of whether customers spend more with you than they cost to acquire.
Metrics Required for an LTV:CAC Ratio
Before you can make any calculations, you’ll need to collect insights. Let’s start with the two components of this ratio. The definition of CAC is relatively simple and reflects how much money it costs to acquire one customer. It can provide a barometer of how many resources you’re spending to get new business.
To find CAC, collect your total sales and marketing spend and the number of new customers acquired over a specific period. Then, divide the sales and marketing spend by the number of new customers. For examples and more information on what costs to include, read our blog post on CAC metrics.
LTV’s definition is a little more complex. It refers to the revenue a single customer generates throughout their relationship with you. The LTV formula can vary depending on your business model and what kind of data you have. Here are some metrics that can help you calculate LTV.
- Monthly recurring revenue or annual recurring revenue per customer: Find your MRR or ARR by dividing your total revenue per month or year by the number of customers. This value tells you how much revenue you can expect monthly or annually from each customer.
- Average months of customer term: Calculate the average number of months your customers usually stay with you. If you don’t have enough data yet, use the current contract length and estimate a renewal rate. If you still don’t have enough data, use the customer churn formula described in the next bullet.
- Customer churn: Subtract the number of customers you have at the beginning of a period from the number of customers you have at the end. Then, divide this value by the number of customers from the beginning of the period. Your churn rate reflects how well you’re retaining and obtaining new customers.
- Gross margin percentage: Subtract the cost of goods sold from your total revenue. Divide this value by your total revenue. Gross profit margins reflect the revenue left after accounting for the cost of your goods or services.
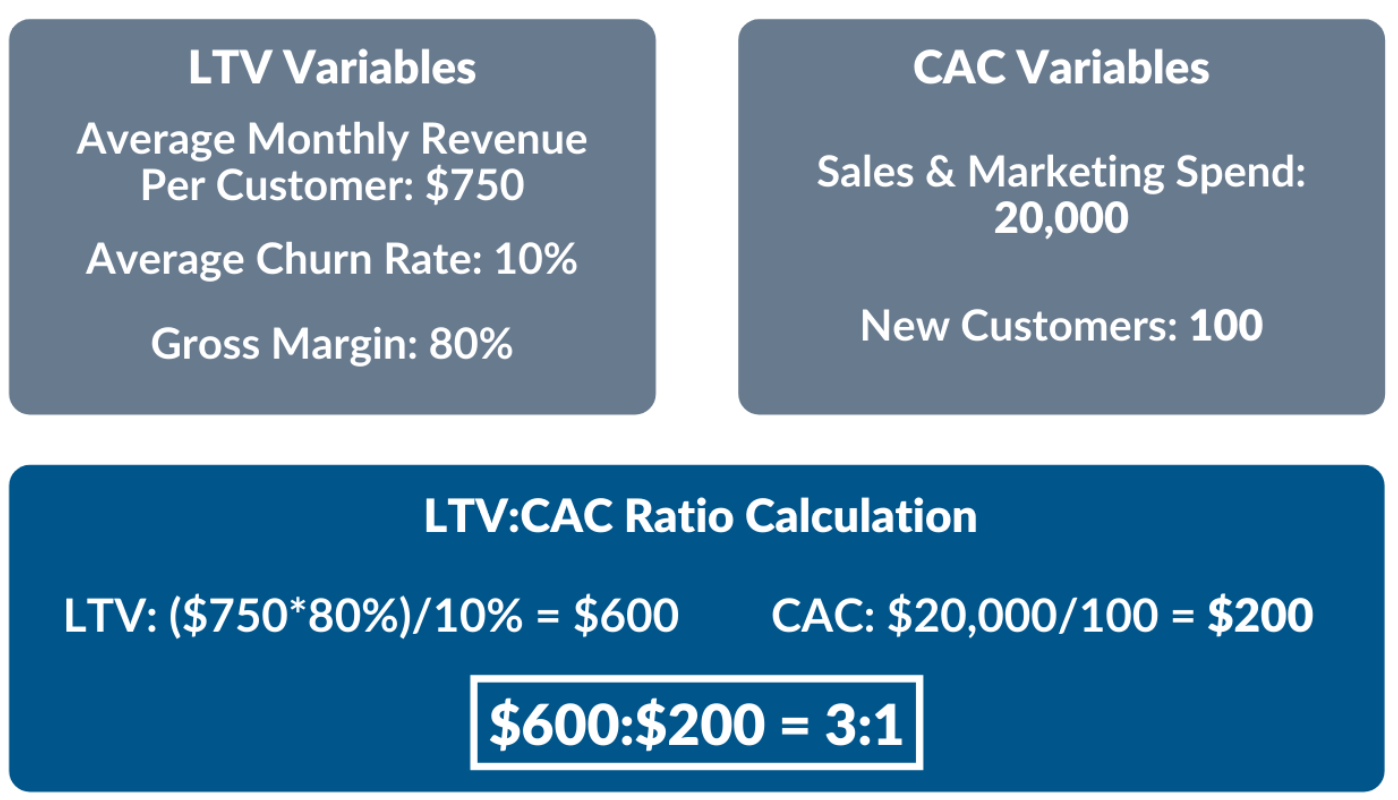
For our purposes, we’ll use the basic LTV formula. Multiply the average revenue per customer by your gross profit margin percentage. Then, divide that value by your average churn rate.
Calculating the LTV:CAC Ratio
With your metrics ready, you can use the following steps with the LTV to CAC formula.
- Calculate LTV: Find your LTV by multiplying your average monthly revenue per customer by your gross margin. Then, divide that number by your turn rate.
- Calculate CAC: Divide your sales and marketing spend by the number of new customers for your chosen period.
- Divide: The resulting numbers reflect dollar amounts. Divide the LTV by the CAC. The resulting number is your ratio. For example, $400/$200 would be 2, giving us a ratio of 2:1.
With this methodology, let’s use some hypothetical financial data to calculate an LTV:CAC ratio for a SaaS business.

LTV:CAC Ratio Benchmarks
Based on the example above, our LTV:CAC ratio is 3:1. But what does that tell us?
Since we used gross margin in our calculation for LTV, it means that for every $1 you spend on customer acquisition costs, you earn $3 in gross margin. Remember, this only considers your sales and marketing costs, plus the cost of goods sold, to give you a good measure of how your sales and marketing “engine” is performing.
Even if you put $1 in and get $3 out, your business isn’t necessarily profitable, since we didn’t consider operating expenses.
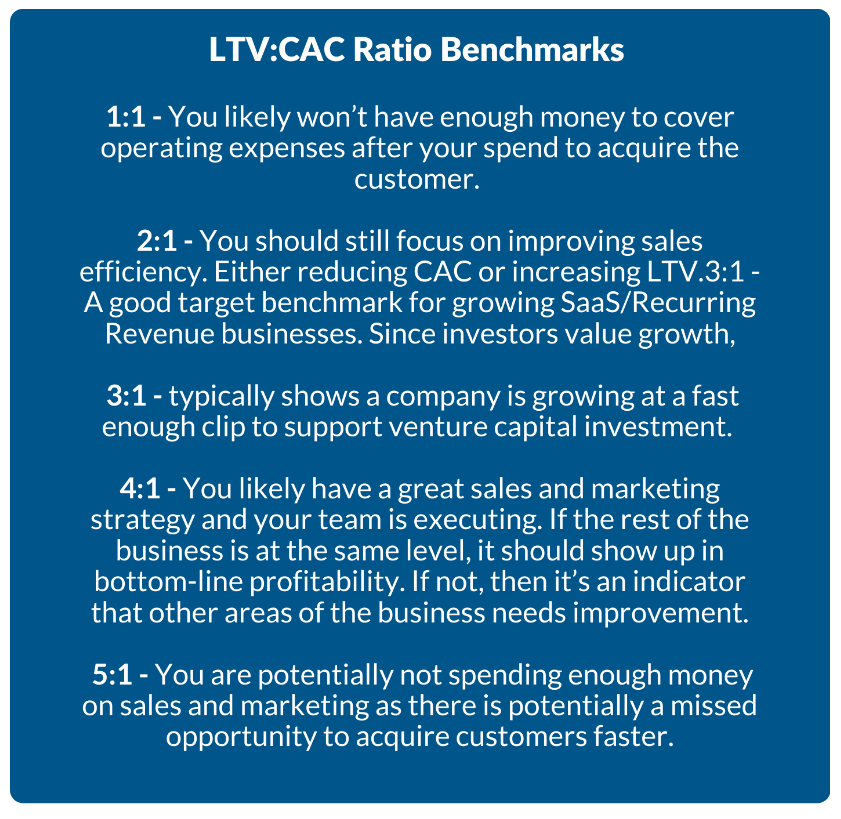
When looking at the LTV:CAC ratio, a few benchmarks give you a sense of how efficiently your customer acquisition and retention strategies are working.
- 1:1: With a 1:1 ratio, you likely won’t have enough money to cover operating expenses after spending to acquire the customer.
- 2:1: You should still focus on improving sales efficiency by either reducing CAC or increasing LTV.
- 3:1: This ratio is a good target benchmark for growing SaaS/recurring revenue businesses. Since investors value growth, 3:1 typically shows a company is growing quickly enough to support venture capital investment.
- 4:1: You likely have a successful sales and marketing strategy and your team is executing. If the rest of the business is at the same level, it should show up in bottom-line profitability. If not, other areas of the business need improvement.
- 5:1: You might not be spending enough money on sales and marketing, as there is potentially a missed opportunity to acquire customers faster.

Remember, these are only guidelines. The appropriate LTV:CAC ratio for your organization will depend on factors like your readiness to scale and your cash flow. For example, significant venture capital might allow you to start with a lower ratio, while businesses with high fixed costs could affect profitability in other areas, despite a high ratio.
Putting it All Together
While these are good benchmarks, your LTV:CAC ratio should be reference points used in conjunction with other data. For example, a 5:1 ratio likely means you are missing an opportunity to acquire customers faster. If top-line revenue is exploding and operations are struggling to keep up, growing that fast might eventually sink the business.
As a sales efficiency and growth metric, LTV:CAC is an excellent indicator of how well you acquire customers. However, it doesn’t necessarily give you a holistic idea of how smoothly your business is operating, since it doesn’t factor operating costs, product development costs and other expenses into the calculation. However, if you can’t acquire customers profitably, there’s likely no business to begin with.
One exception to this is venture-backed companies. Venture capital can offset unprofitable acquisition costs in the short- and mid-term. However, the strategy there is typically hyper-growth at all costs to create network effects and scale. So it’s not for everyone! It all depends on your business model and how you want to grow.
What Can You Do With the LTV:CAC Ratio?
You know LTV:CAC can reflect your profitability, but like all metrics, it doesn’t encompass every possible factor. Still, this KPI can help guide business decisions like these.
- How much to spend on acquisition: Your ratio can help you determine the ideal amount to spend on acquisition to ensure sustainable growth. LTV:CAC offers a quantifiable goal and provides a quick way to tell if your efforts are working.
- Where to focus acquisition efforts: Since the LTV:CAC calculation factors in the profits earned from each customer, it can help you see which customers best support your ratio. For example, you can look at LTV:CAC ratios for different customer categories. If your small business clients give you more profits, you could focus on them over enterprise-level clients.
- Appealing to stakeholders: If you can hit an ideal balance, you generally look more attractive to potential investors and other stakeholders. It shows you have a sustainable operation and are on a positive growth trajectory.
As with other KPIs, you’ll get more mileage from your LTV:CAC ratio if you use it alongside other metrics to create a comprehensive picture of your performance.
Ways to Increase Your LTV:CAC Ratio
If your LTV:CAC ratio is lower than you’d like, you can try a wide range of strategies to improve it.
1. Optimize Your Conversion Rate
A low conversion rate can make it harder to turn prospects into leads and customers, which drives up the CAC. Focus on the various steps of the pipeline and analyze where there are areas to improve. For example, maybe you are not targeting the right decision-makers or you’ve added too many steps in the assessment/proposal process for a customer to convert. Make sure your sales team is providing prospect feedback during the customer discovery process to build better objection handling in your sales training.
2. Find the Right Channels

Some channels work better than others. Find the ideal marketing channels by testing and measuring the impact of marketing dollars. Are higher-quality customers coming through one channel vs. another? Using data based on client behaviors, consider segmenting your audience to target your strategies toward the most effective prospects. Saying “no” to customers that aren’t good fits for your team will also drastically cut down on time spent with prospects that aren’t ideal for your business. Bringing in a lot of new clients that do not match your ideal profile will only create headaches for your team and increase churn rates.
3. Simplify Your Sales and Onboarding Processes
Long, cumbersome sales processes can increase your CAC and create a negative experience, making acquiring and retaining customers more challenging. Simplify the process as much as possible, and guide your customer through it with engaging, easy-to-follow navigation.
Onboarding should also be smooth and simple. As part of the acquisition process, reducing onboarding costs and improving the experience can boost CAC.
4. Focus on Specific Metrics that Affect LTV
Many other metrics can impact your LTV, such as the cost of goods sold and gross margins. Scrutinize the metrics used in the LTV formula and see if there’s room for improvement. You might focus on increasing the cost of goods sold by revisiting your pricing model, or you could increase the MRR with different upselling techniques. Remember, retaining and upselling current customers are easier and more profitable than acquiring new logos.
5. Build Customer Loyalty
A loyal customer base is much more likely to generate additional revenue than a disloyal one. Existing customers are 50% more likely to try new products and typically spend 31% more than new customers. With high acquisition costs, building loyalty can provide extensive financial benefits. Consider strategies like loyalty programs and improved customer service to help retain customers and encourage more spending.
Put Your Metrics to Work With Compass East
Customer acquisition costs, lifetime value and the LTV:CAC ratio are three valuable metrics all businesses can use. Compass East takes a bottom-up approach to create the financial infrastructure needed to quickly capture the financial data to calculate KPIs like LTV and CAC for our clients. These metrics are the outputs, but a significant amount of work needs to happen to capture the inputs.
Reach out with any questions or to learn more about how we make KPI dashboards a reality!

