
So far, we’ve looked at the traditional challenges that face finance and accounting teams and how to work from the bottom up to overcome those challenges. We’ve explored the value of a Chart of Accounts and examined the technology stack to use to streamline F&A operations. Additionally, we’ve looked at lagging KPIs and started to explore the value of financial forecasting through predictive models like cash forecasts, budgets and financial models.
All of this brings us to the last phase of our journey. Putting the above together lets us learn how to predict financial performance through leading indicators.
Predict Financial Performance Through Leading Indicators
Leading indicators are developed and tracked using your business’ daily and monthly activities. While lagging indicators are pulled directly from the financials, leading indicators play a major role in predicting current and future performance. Leading indicators are the little actions that can contribute to significant performance changes over time. Leading indicators also give you the opportunity to course-correct and make strategy adjustments based on predicted performance. Ultimately, those daily and weekly activities become quantifiable trends that show up in a company’s financials and lagging indicators. The goal with leading indicators is to start tracking lots of them and over time hone in on the most impactful.
Let’s use a business example to show how leading indicators can help predict financial performance. You want to expand your company into a new market. How do you know you are successful? It is obvious in hindsight a few quarters into the expansion when you can look back at increased revenues and profits, but how do you measure success in the moment or how growth is progressing?
The easiest leading indicators to understand are sales activities since they directly correlate with new revenue. Think of the pipeline funnel as a machine. Trackable activities in the “top of the funnel” or inputs, over time, move through the sales process to generate “outputs” in the form of new customers and revenue.
So going back to the goal of expanding in a new market. You might hire a salesperson to identify potential clients that fit your ideal customer profile in that market. Once they build a sales list, they begin to make calls, reach out through cold emails, or ask for referrals from their network. How many calls did that salesperson make throughout the week? How many emails did they send? How many referrals did they get? Those “top of the funnel” activities start to get tracked. Those activities turn into leads. Those leads are qualified based on if they are an ideal customer for the business (based on the size of the company, industry focus, or pain points). Discussions are had with those qualified leads, which turn into proposals. Clients say yes or no to those proposals and those proposals may differ in size based on their contract value or structure. Once signed, those clients are handed off to the operations team to service the client, and revenue is generated.
So taking that example, we can start to measure pipeline stages and predict the amount of sales activity needed to hit revenue projections. Let’s dig into that example in detail. During the month:
- Calls/Emails/Referral Asks: 200
- Leads/Screens: 50 (Calls to Leads – 25% conversion)
- Qualified Leads: 25 (Leads to Qualified – 50% conversion)
- Proposals: 10 (QL to Proposals – 40%)
- Proposals Won: 5 (Proposals to Won – 50%)
- Average Contract Value of Proposals: $100,000/y
From this simple pipeline example (and enough time to make it statistically significant) you can realistically predict that for every salesperson that performs 200 outbound activities per month, it should result in 2.5% (5 out of 200) of those activities will result in a new client worth $100k in new revenue. These are all leading indicators that can be tied to new revenue ($500k) per month which is the lagging indicator that comes out of the financials. This will drive hiring plans, quota development, and identify how to improve activities to increase pipeline numbers (if we get more focused on identifying the right types of customers to work with, it increases qualified leads, which results in more proposals and proposals won). As you can start to see, leading indicators are crucial to measuring and understanding many aspects of business performance.
Leading vs. Lagging Indicators
Leading indicators and lagging indicators help you see if your business is on track toward its goals. You can use both to make adjustments to your methods. The major difference is that leading indicators are forward-looking and lagging indicators look backward.
Lagging Indicators
The best way to define a lagging indicator is as something that already happened. A lagging indicator shows your historical performance and the result of certain changes or circumstances. With lagging indicators, you can assess whether you achieved the results you wanted.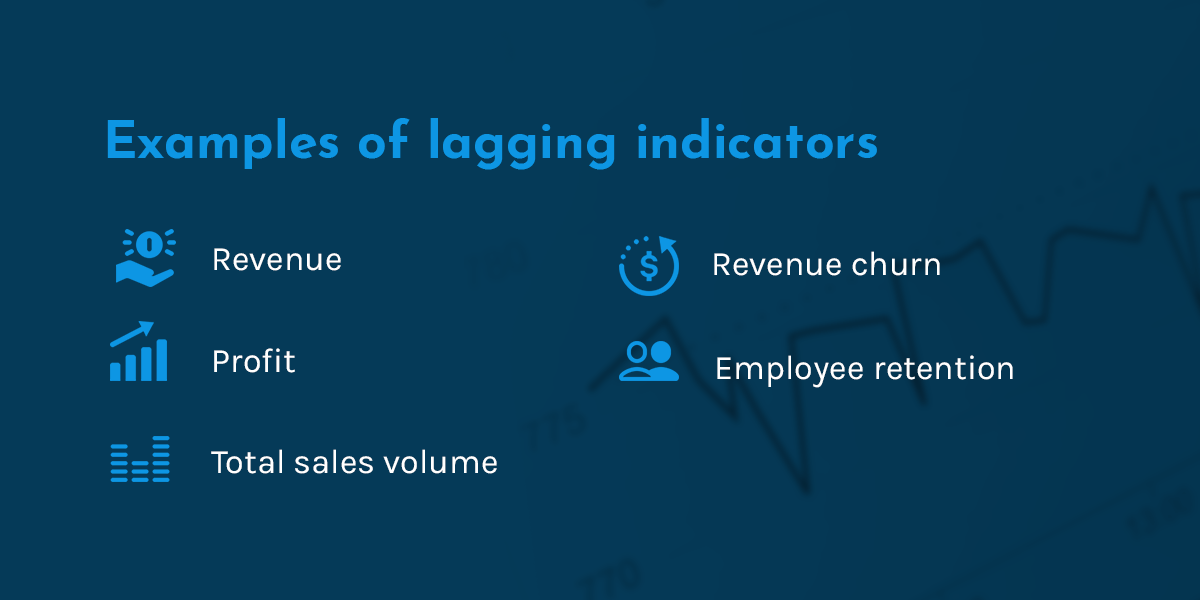
Examples of lagging indicators individual businesses can measure include:
- Revenue
- Profit
- Total sales volume
- Revenue churn
- Employee retention
Looking at your business’s revenue for the quarter, you can easily see if it’s increased or decreased compared to the previous quarter or the same quarter last year. If it’s increased, that’s a positive thing. You can then look more closely at leading indicators to see what you’re doing right and what’s contributing to the rise in income.
If revenue has fallen, you also want to look more closely at the situation to see what has changed. A drop in revenue can signal that there’s a major issue that needs attention or your company has saturated the market and might need to look toward expansion to maintain income levels and continue to build profit.
Leading Indicators by Department
Leading indicators are operational indicators from daily activities. From a big picture point of view, leading indicators can signal optimism.
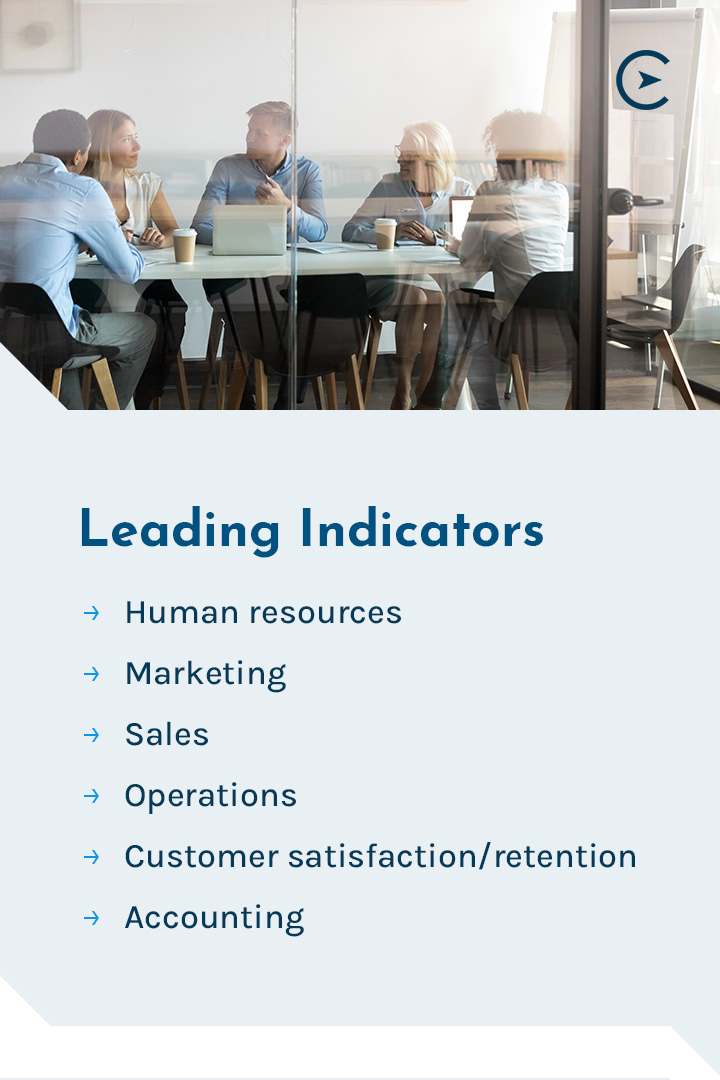
At the individual business level, leading indicators are the daily activities carried out by a department. Your company can use leading indicators from the following departments to predict its financial future:
- Human resources: Leading indicators from HR include the number of new hires in a given quarter and the number of resignations. An increasing hire rate generally signals that your company is growing. It can also mean your hiring message is resonating with qualified candidates. On the other hand, an increasing resignation rate can signal that your company is headed for trouble. It can mean employees are dissatisfied or signal that there’s a larger issue with the company culture. A high turnover rate costs your company money, which impacts its overall financial health.
- Marketing: In the marketing department, leading indicators track how well certain marketing endeavors are doing, such as advertising on a particular social media platform. So marketing spend by channel, resulted in X number of clicks on our website, X number of new client form fills, and X number of qualfied leads for our sales team.
- Sales: Leading indicators for the sales team include the number of sales calls, meetings and qualified leads in a week, month or quarter. You can also look at the number of sales made by individual representatives each day. Other leading indicators for the sales department include the number of calls made and the number of customers met.
- Operations: On the operations side, leading indicators may include efficiency and speed metrics during a week, month or quarter. So how quickly a manufacturing company is able to move a product through an assembly line. Or the amount of time suppliers ship parts needed for assembly. They also include any compliance issues faced during a defined period and the number of errors in a particular period.
- Customer satisfaction/retention: Based on customer data, you can see how your patrons feel about your business based on how many are making repeat purchases. It’s commonly known that it costs more to attract new customers than to retain existing ones. Exploring leading indicators in this area can give you information on how you can improve efforts to keep current customers happy so they choose you over competitors and tell their friends about you.
- Accounting: For the accounting department, leading indicators could include how quickly the company is able to collect on accounts receivable, inventory turnover, or how quickly they are paying bills.
You can use leading indicators to track your department’s performance from a numbers standpoint. For example, you can see how many calls you made during a week or the number of sales you made in a day. Using these numbers, you can begin building your company’s scorecard to make performance predictions.
Build scorecards by following these four steps:
- Keep it simple: Your scorecard should tell you at a glance whether you met goals or not. Focus on big-picture leading indicators, rather than getting too into the weeds. Start with many leading indicators, then over time, meas
ure and narrow down the list to the most impactful indicators. - Define your leadership team: Once you’ve picked the leading indicators, choose the team that will guide the department through the process.
- Know what to measure: Deciding what to measure can be as easy as answering the question, “how do you know if you had a good week (or month or quarter)?” The indicators that signal a good period are what you want to focus on.
- Identify core processes: The core processes are the functions that keep your business ticking, such as HR, sales, marketing, and accounting. Use the leading indicators from each of these core processes when building your scorecard.
Financial Scorecard Development
As with pretty much everything else with your company, once you make a financial scorecard, the process isn’t over. The first — and second, third and fourth — version of the scorecard won’t be perfect. You’ll likely find that you need to add and subtract leading indicators over time before you identify the most important metrics.
For example, in sales and marketing, you’ve decided your most important lagging metric is your average contract value per customer (ACV). If your ACV increases, it drives topline revenue and profitability, onboards larger clients, and creates operational efficiencies. What you want to do is determine the leading activities that contribute to the number.
Sticking with the sales example from above, to increase ACV, you might need to land clients worth more than $1 million in revenue and in a specific industry. The following leading indicators can help you determine the lagging indicator, ACV:
- Revising your sales target list to identify companies greater than $1m in revenue
- The number of meetings or calls you set up this week increases to focus on this specific client type
- The number of prospects who fit the ideal customer profile increases
- The number of qualified prospects you had a proposal discussion with this week increases because they are a better fir
- The average size of a proposal in the pipeline increases because you can charge more
- The number of leads who converted to a contract increases because they aren’t scared off by the price point
With more revenue coming in per client, maybe there are fewer individual clients coming in the door. They pay faster because they have money to pay you which speeds up collections and cash flow. Since there are fewer clients, you might not need as many operations team members to service clients which increases profitability of the business. Since clients are more uniform coming from a specific industry, operations get better at servicing clients that are similar and gain efficiency.
As you accumulate information, your data gets better and better. As you can see, since you are tracking leading indicators and have One Metric That Matters (ACV in this case), a strategic business decision change (honing in on a better target customer) improves many aspects of the business. Suddenly the department level leading indicators across your company improve and eventually those changes start to show up in the form of increased revenue, profitability, and client/employee happiness. The impact of that strategic decision can be deemed a quantifiable success. 
In accounting, your goal is to reduce the accounts receivable turnover rate to improve your company’s cash flow and increase efficiency. Speeding up the payment process and getting clients to pay on time protects your company from financial shock and minimizes risk.
The following leading indicators can help you improve accounts receivable:
- Percentage of high-risk accounts: High-risk accounts are those clients who might have a history of late payments or don’t have good credit records. Ideally, the percentage of high-risk accounts will be low. The higher it is, the longer it’s likely to take for your company to get paid.
- Days Sales Oustanding (DSO): DSO is how long it takes your company to get paid from the time it sends invoices. A DSO under 30 is ideal, as it means your clients are largely paying their invoices within 30 days of receipt. The further from 30 days you get, the more likely you are to have missed payments or clients who forget to pay.
- Operational cost per collection: Operational cost per collection is how much your company spends to get paid. It gives you a big-picture view of how much you’re spending to get paid by clients.
- Number of revised invoices and staff productivity: These are two leading indicators that are closely connected. If your team regularly has to adjust and fix up invoices, it’s a sign that something’s amiss. If you have a large accounts receivable department, but only a handful of invoices sent monthly, your productivity rate is likely low, which can affect how quickly clients pay and how effective your invoicing system is.
Improving your account receivable team’s efficiency, reducing the percentage of high-risk accounts and tracking DSO can all help you achieve a better turnover rate and get paid faster.
Use Leading Indicators to Predict the Future
Once you have leading indicators for each department, your management team can make intelligent performance predictions and project the outcome of strategic decisions intelligently. The results will never be exactly what you projected or perfect, but the predictive analysis can be an excellent guidepost for the future.
For example, adding a new salesperson who makes X number of calls might add X amount of new revenue. Tweaking the upselling process can increase your customer retention rate by X%.
There are no guarantees about your company’s future, but leading indicators can help you see whether you’re steering the ship in the right direction or give you the information you need to course-correct in time.
Compass East Can Help You Make Performance Predictions With Leading Indicators

Leading indicators can be valuable when it comes to predicting your company’s future performance. If you’re not sure where to start or what to track, Compass East can help. We provide a complete accounting and financial team to our clients and can help you develop a scorecard that evolves as your needs evolve. Contact us today to learn more.